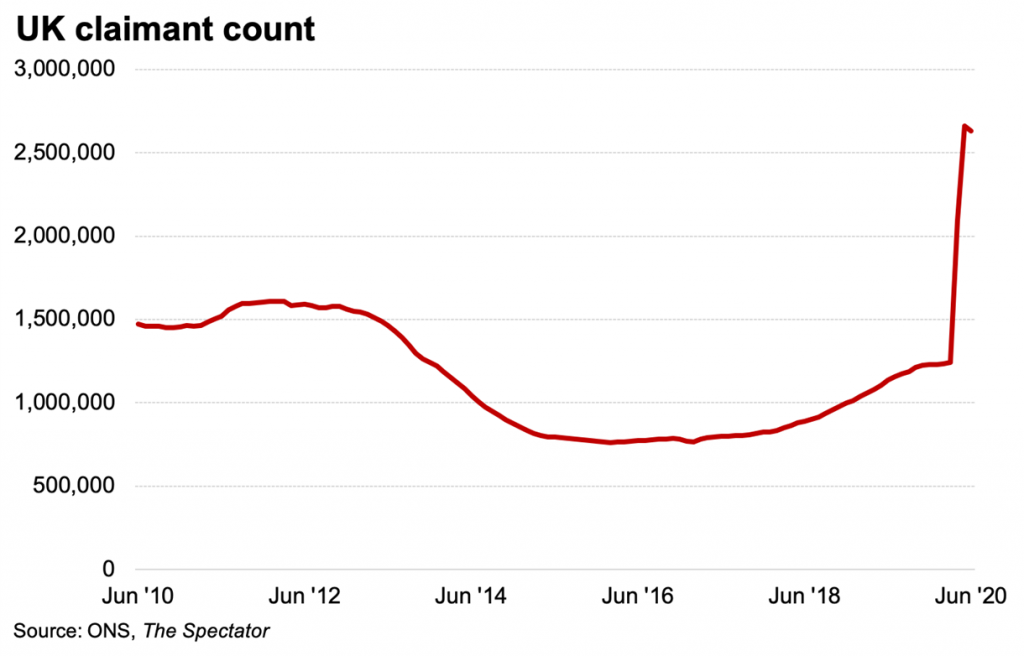
Does this graph from The Spectator showing furlough claims make your blood run cold?
How close to the cliff edge is your company? Where are the pinch points, how can you cut costs to stay in business?
When Rishi Sunak announced the furlough scheme on May 5, he anticipated that some 10% of businesses would sign on. In the event, about 10 million employees have been furloughed, involving 1 million businesses.The scheme is continuing, albeit it in a watered down format—but it isn’t enough to save all companies. And it expires at the end of October. Earlier this week Pizza Express closed 67 restaurants, impacting over 1,000 people and Currys PC World followed, laying up more than 800. They follow DW Sports and Hays Travel, who made similar annoucements this week.
We’ve been here before. Back in the Great Depression–1928 – 1933 – blue chip companies like Morgan Stanley, Goldman Sachs and Bear Stearns were almost destroyed (and of course, in 2008 Bear Stearns was destroyed.)
More recently Carillion, MotherCare, British Home Stores, Jamies Italian, Patisserie Valerie, Thomas Cook have all left the stage; almost certainly because they failed to have a good handle on their liquidity needs.
Close to crashing?
We all know cash is king when the chips are down—but monitoring it closely can be problematic. Welcome to Forecast 5’s unique new daily cashflow forecasting routine. Forecast 5 creates separate, individual records for all streams, be they income, direct or overhead costs, asset acquisitions and disposals, loans taken on and advanced, and equity flows. These all impact, in their own way, Forecast 5’s key reports; cashflow, profit and loss, balance sheet and funds flow statements.
Whilst the main program divides these streams into monthly segments Forecast 5’s new Daily Cashflow (DCF) separates them into daily components over three months. Thus, if you are expecting a £30,000 receipt, payable in three installments, say on August 5, September 5 and October 5, you can see the exact impact of each payment on your cash balance, day by day over the 90 day period.
And, when you are ready, the 90 day analysis can be rolled forward for the next three monthly view.
Should, for instance, the August payment be delayed, simply move the payment in the DCF worksheet to the new expected date. If one of these payments is likely to be reduced, reduce the relevant flow in the DCF worksheet and watch the effect on the bottom line cash balance.
If a particular income stream is expected to generate more than currently provided – happy days! – either add to the record value in Forecast 5 or add an additional record to make up the difference – resync the DCF worksheet and the effect will cascade down immediately into the Daily Cashflow.
The mechanics explained
Put it another way: Daily Cashflow is for massaging existing cashflows into their daily components, thus generating your cash balance, day by day over a rolling ninety day period.
In order to ensure accuracy in the four key reports, the main drivers of the forecast remain in Forecast 5 itself.
You can move or reduce these flows within DCF or, by adding in the body of Forecast 5 itself, you can increase these flows in the worksheet.
Watch the big picture – but focus on the minutia
While quarterly and annual forecasts are essential, in extremis you (and your bankers and investors!) will want to know exactly where you are on a day by day basis.
Forecast 5 allows you to keep tabs on both the big picture – the overall financial structure of the organisation – whilst at the same time focusing as if with a microscope on the minutia – and that’s what will count in the long run.
Users praise Forecast 5 for its ease of use and particularly its accuracy and speed—no more collating data in one spreadsheet and moving it to another with the inevitable cashflow risks involved.
Daily Cashflow now adds another important feature to the range.
Click here for a 21-day free trial of Forecast 5, the acclaimed economic forecasting program.
